Atlas of Quasar Energy Distributions
Elvis et al (1994) ApJS 95, 1 (ADS link)
 |
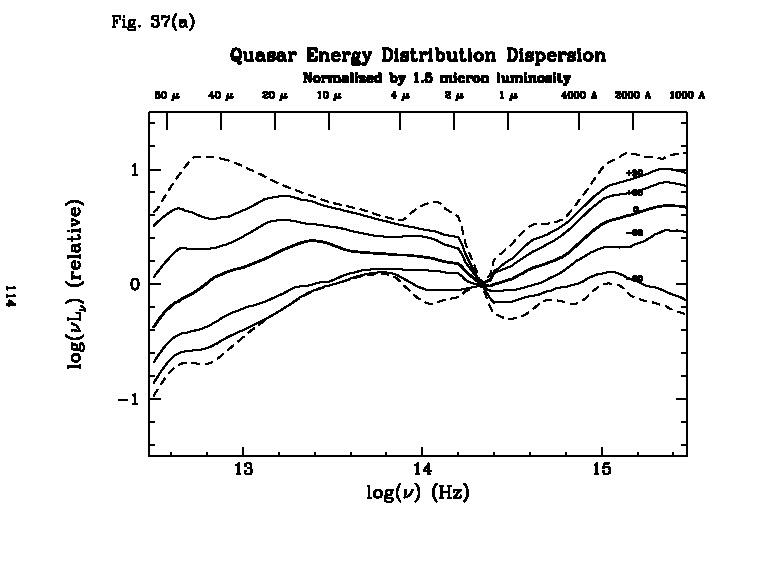
| Median and -90, -68, +68, +90 percentile SEDs, normalized at 1.5 microns.
Dashed line gives the +-100 percentile envelope. |
|
|
|
The QED Atlas
The QED Atlas project (Atlas of Quasar Energy Distributions) published
radio to X-ray spectral energy distributions (SEDs) of 47 AGN/quasars
and demonstrated the diversity of quasar SEDs by generating the median SED
and various percentile SEDs of the sample. No attempt has been made to update the data presented here, which should conform
to that published in the original paper.
In particular, throughout we use cosmological parameters H0 = 50, Omega0 = 1, and Lambda = 0. What can I say, it made sense in 1994.
The most useful results of the paper are the median and percentile SEDs.
For further information on the data, contact Jonathan McDowell ([email protected]) or Martin Elvis ([email protected]).
- Sample
- Emission line removal
- Photometry zero points
- Dereddening
- Host galaxy subtraction
- The Atlas - full radio to X-ray SEDs
- The Atlas - 0.1-100 micron SEDs with and without starlight subtraction
- Sample derived properties
- Bolometric and multiwavelength luminosities
- Median and percentile SEDs
- Bolometric correction factors
- QED Atlas team members

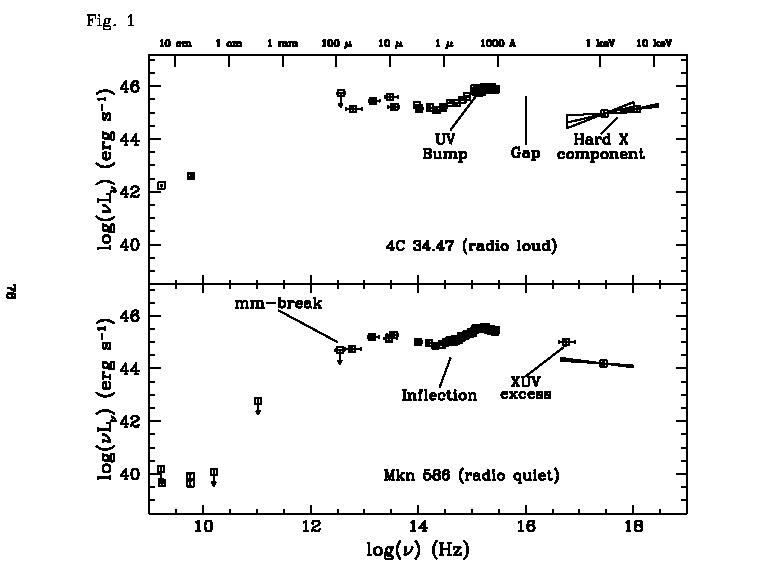
Fig. 1. Examples of radio-loud (4C 34.47, top) and radio-quiet (Mkn 586,
bottom) quasar energy distributions, illustrating the main continuum
features. The energy distributions show the logarithm of the
energy per unit logarithmic frequency interval, in the rest frame.


